Table of Contents
NetCentric Security Project
Introduction
During the NetCentric Security project we developed a DDoS migitation system. The focus of our remediation device is to mitigate more advanced DDoS attacks, especially highly distributed HTTP-GET floods. Other attacks such as ICMP, UDP, TCP-SYN, TCP-FIN can be filtered out with easy thresholding rules. There are several commercial applications on the market, so we did not focus on this. However, if HTTP-GET floods break down webservers, there is no easy way to distinguish normal from bot requests. Our remediation device learns normal traffic behavior by observing the service. Under an attack, it can then automatically filter out the abnormal and malicious requests or prioritize them. The following video demonstrates the capabilities of our system.
Create your own firewall filter rules against DDoS attacks using the IP Density Estimation demo.
Testbed Setup
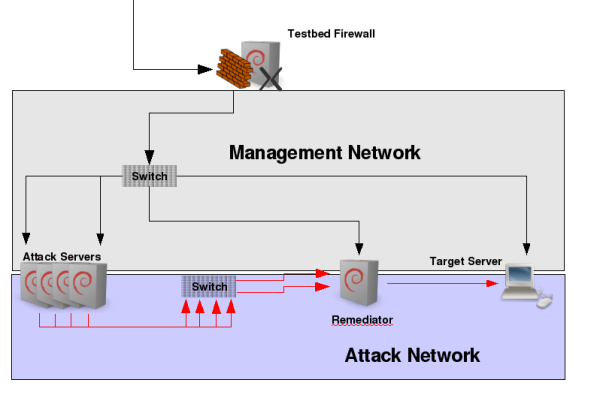
The above illustration shows our testbed setup in an easy way. Besides the management network on the top for accessing the machines and exporting the GUI, the attack network can be found below. There, the attacking machines on the left generate user and attack traffic targeted to the target webserver server on right on a 1 GBit link. All traffic passes through our remediation system. Routing is setup such that we can use arbitrary IP addresses left from the remediator. Note that this is a very abstract drawing. In practise, there are several other devices and components involved, e.g. we used an IXIA IxLoad device for attack traffic generation and Endace Capturing Boards in the remediator connected to network TAPs. We also tested a upstream connected Radware Defense Pro DDoS mitigation device. This device filtered standard DDoS attacks and our remediation system behind it filtered attacks which passed the Defense Pro. For IP filtering we used nf-HiShape, a high performance open source shaping Linux kernel module.
User Simulation
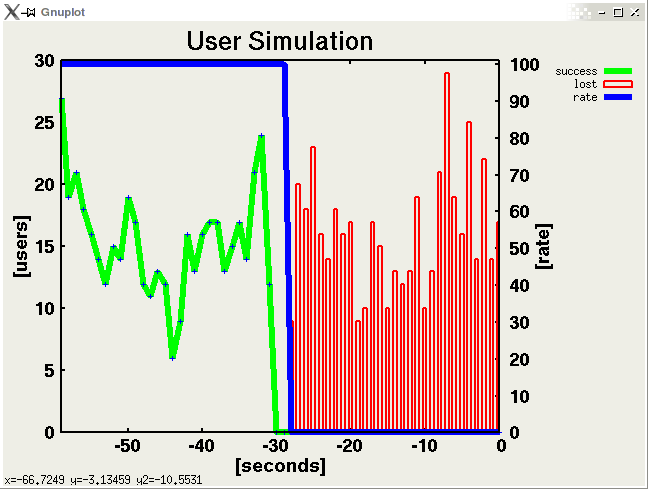
The user simulation on one of the attack servers simulates normal users accessing the web service on the target device. To keep things realistic we developed and used repache, a tool for replaying real HTTP logfiles. The tool also measures how many of the requests are answered by the server as illustrated in the screenshot bolow. The green curve are successfull HTTP users (comprising of multiple requests) whereas the red bars indicate failed users (after a launched DDoS attack).
Remediator GUI
The following screenshots show the GUI of our remediaton system.
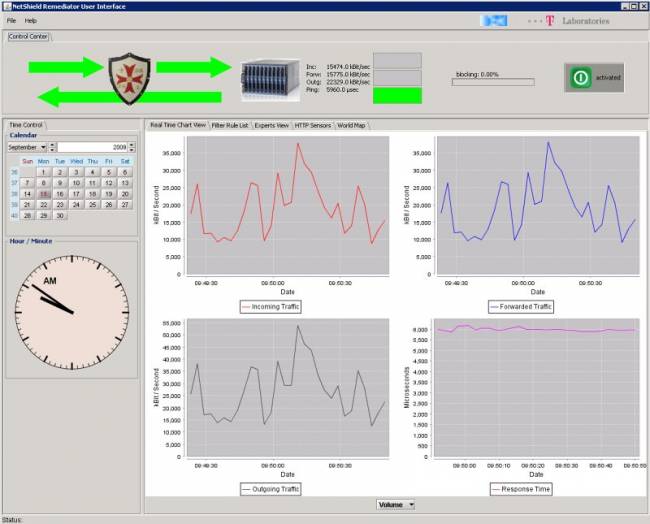
1. Normal operation mode monitoring user traffic. The color of the arrows in the top left illustrate the attack status of the system - everything is ok in this case.
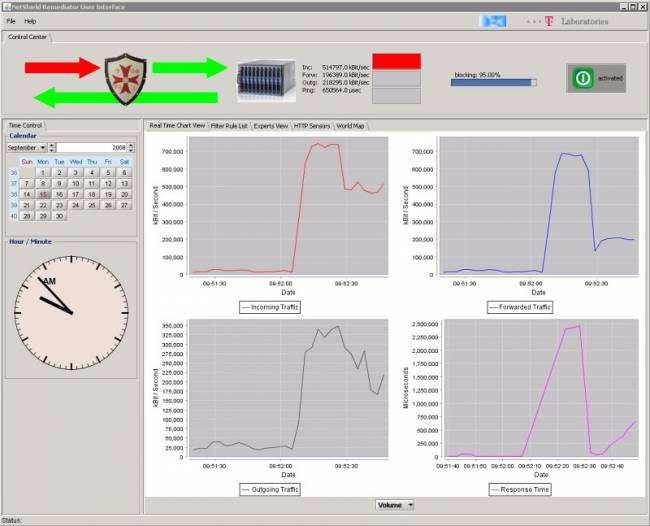
The charts show traffic to the remediator (top left), traffic from the remediator being forwarded to the server (top right), traffic from the server towards the internet (bottom left) and the availability of the HTTP server (bottom right).
2. Launching a HTTP-GET attack against the web server with 50,000 zombies. The remediator immediately detects the DDoS attack (red color) und enables an emmergency filter rule set. This ensures availbility for most of the normal users with certain collateral damage (denying some legal users). The rules have been lernt during normal operation mode and descibe normal behavior. This mode can be switched on very fast and bridge the time gap until the remediator has calculated better rules according to the parameters of the attack (see (3)). The bar top right shows that in this mode 95% of the whole IP space is blocked.
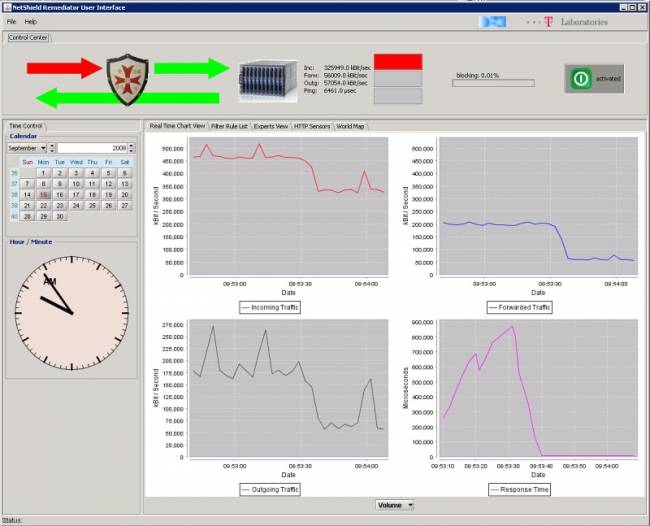
3. Detailed Defense Phase: Attack traffic has been analyzed and the remediator now blocks only the attackers (0.01% in the IP space). It can be observed that less attack traffic is passed to the server (top right) and server load drops to a normal level (bottom right). The attack is considered to be mitigated successfully. After the attack ends, the remedaitor will return to normal operation mode.
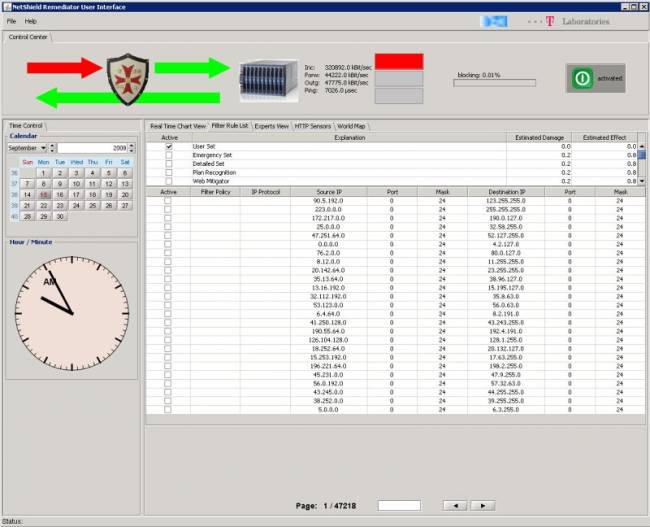
4. Listing the filter rules. During attack, the rules (and therefore the attack sources) can be listed for detailed forensics.
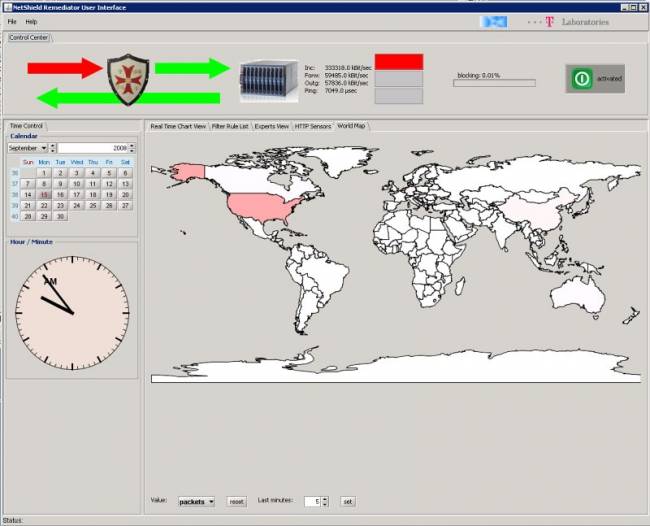
5. Worldmap: Furthermore, the geographical location of attackers can be visualized in the world map. High attack traffic is visualized by the red color.
